
Glide
- Client
- Glide
- Industry
- Sport and hockey statistics
- Services
- Mobile app
The problem
Hockey statistics, games and news in a single experience
The hockey statistics apps available on the market often offered an incomplete experience: poorly organised data, information that was not detailed enough and dated interfaces made it hard for fans to quickly find what they really cared about.
For anyone wanting to look up detailed statistics, analyse the performance of teams and players, follow games or simply stay up to date, navigation was often unintuitive and scattered.
Glide was born from this need: to create a modern, engaging app that brings together hockey statistics, results, news and content in a single experience that is simple and enjoyable to use.
The process
From market analysis to feature development
- 01
Market and user needs analysis
We analysed the main apps dedicated to hockey and sports statistics, identifying their strengths, limits and opportunities for improvement. The goal was to understand which information really matters to fans and how to make it more immediate, accessible and engaging to browse.
- 02
User experience design
We designed a modern, clean and intuitive interface, organising the information so that users can quickly find teams, players, games and statistics. Great care went into data visualisation, turning complex numbers and statistics into clear, easily readable information.
- 03
Feature development
We built a complete ecosystem for hockey fans, integrating advanced statistics, detailed team and player profiles, game results, news and interactive content. On top of this we added a gamification layer with quizzes, points and premium content, making the experience more dynamic and engaging.
The solution
A single entry point to the world of hockey
We built Glide, an app designed to give hockey fans a single entry point to statistics, games, teams, players and updates.
The interface combines a modern, recognisable design with simple, immediate navigation, letting users explore a large amount of information without making the experience complex.
-
Statistics and performance
Statistics are organised in detailed cards and graphic visualisations that make it quick to understand how teams and players are performing.
Users can browse data, compare results and dig into the different seasons and competitions through a clear, intuitive visual experience.
-
Teams, players and games
Every team and player has a dedicated section with statistics, images and in-depth information. Games are presented through complete cards as well, giving immediate access to results, data and relevant details.
Users can move easily from the overall view of the league to the analysis of a single team, player or game.
-
News and updates
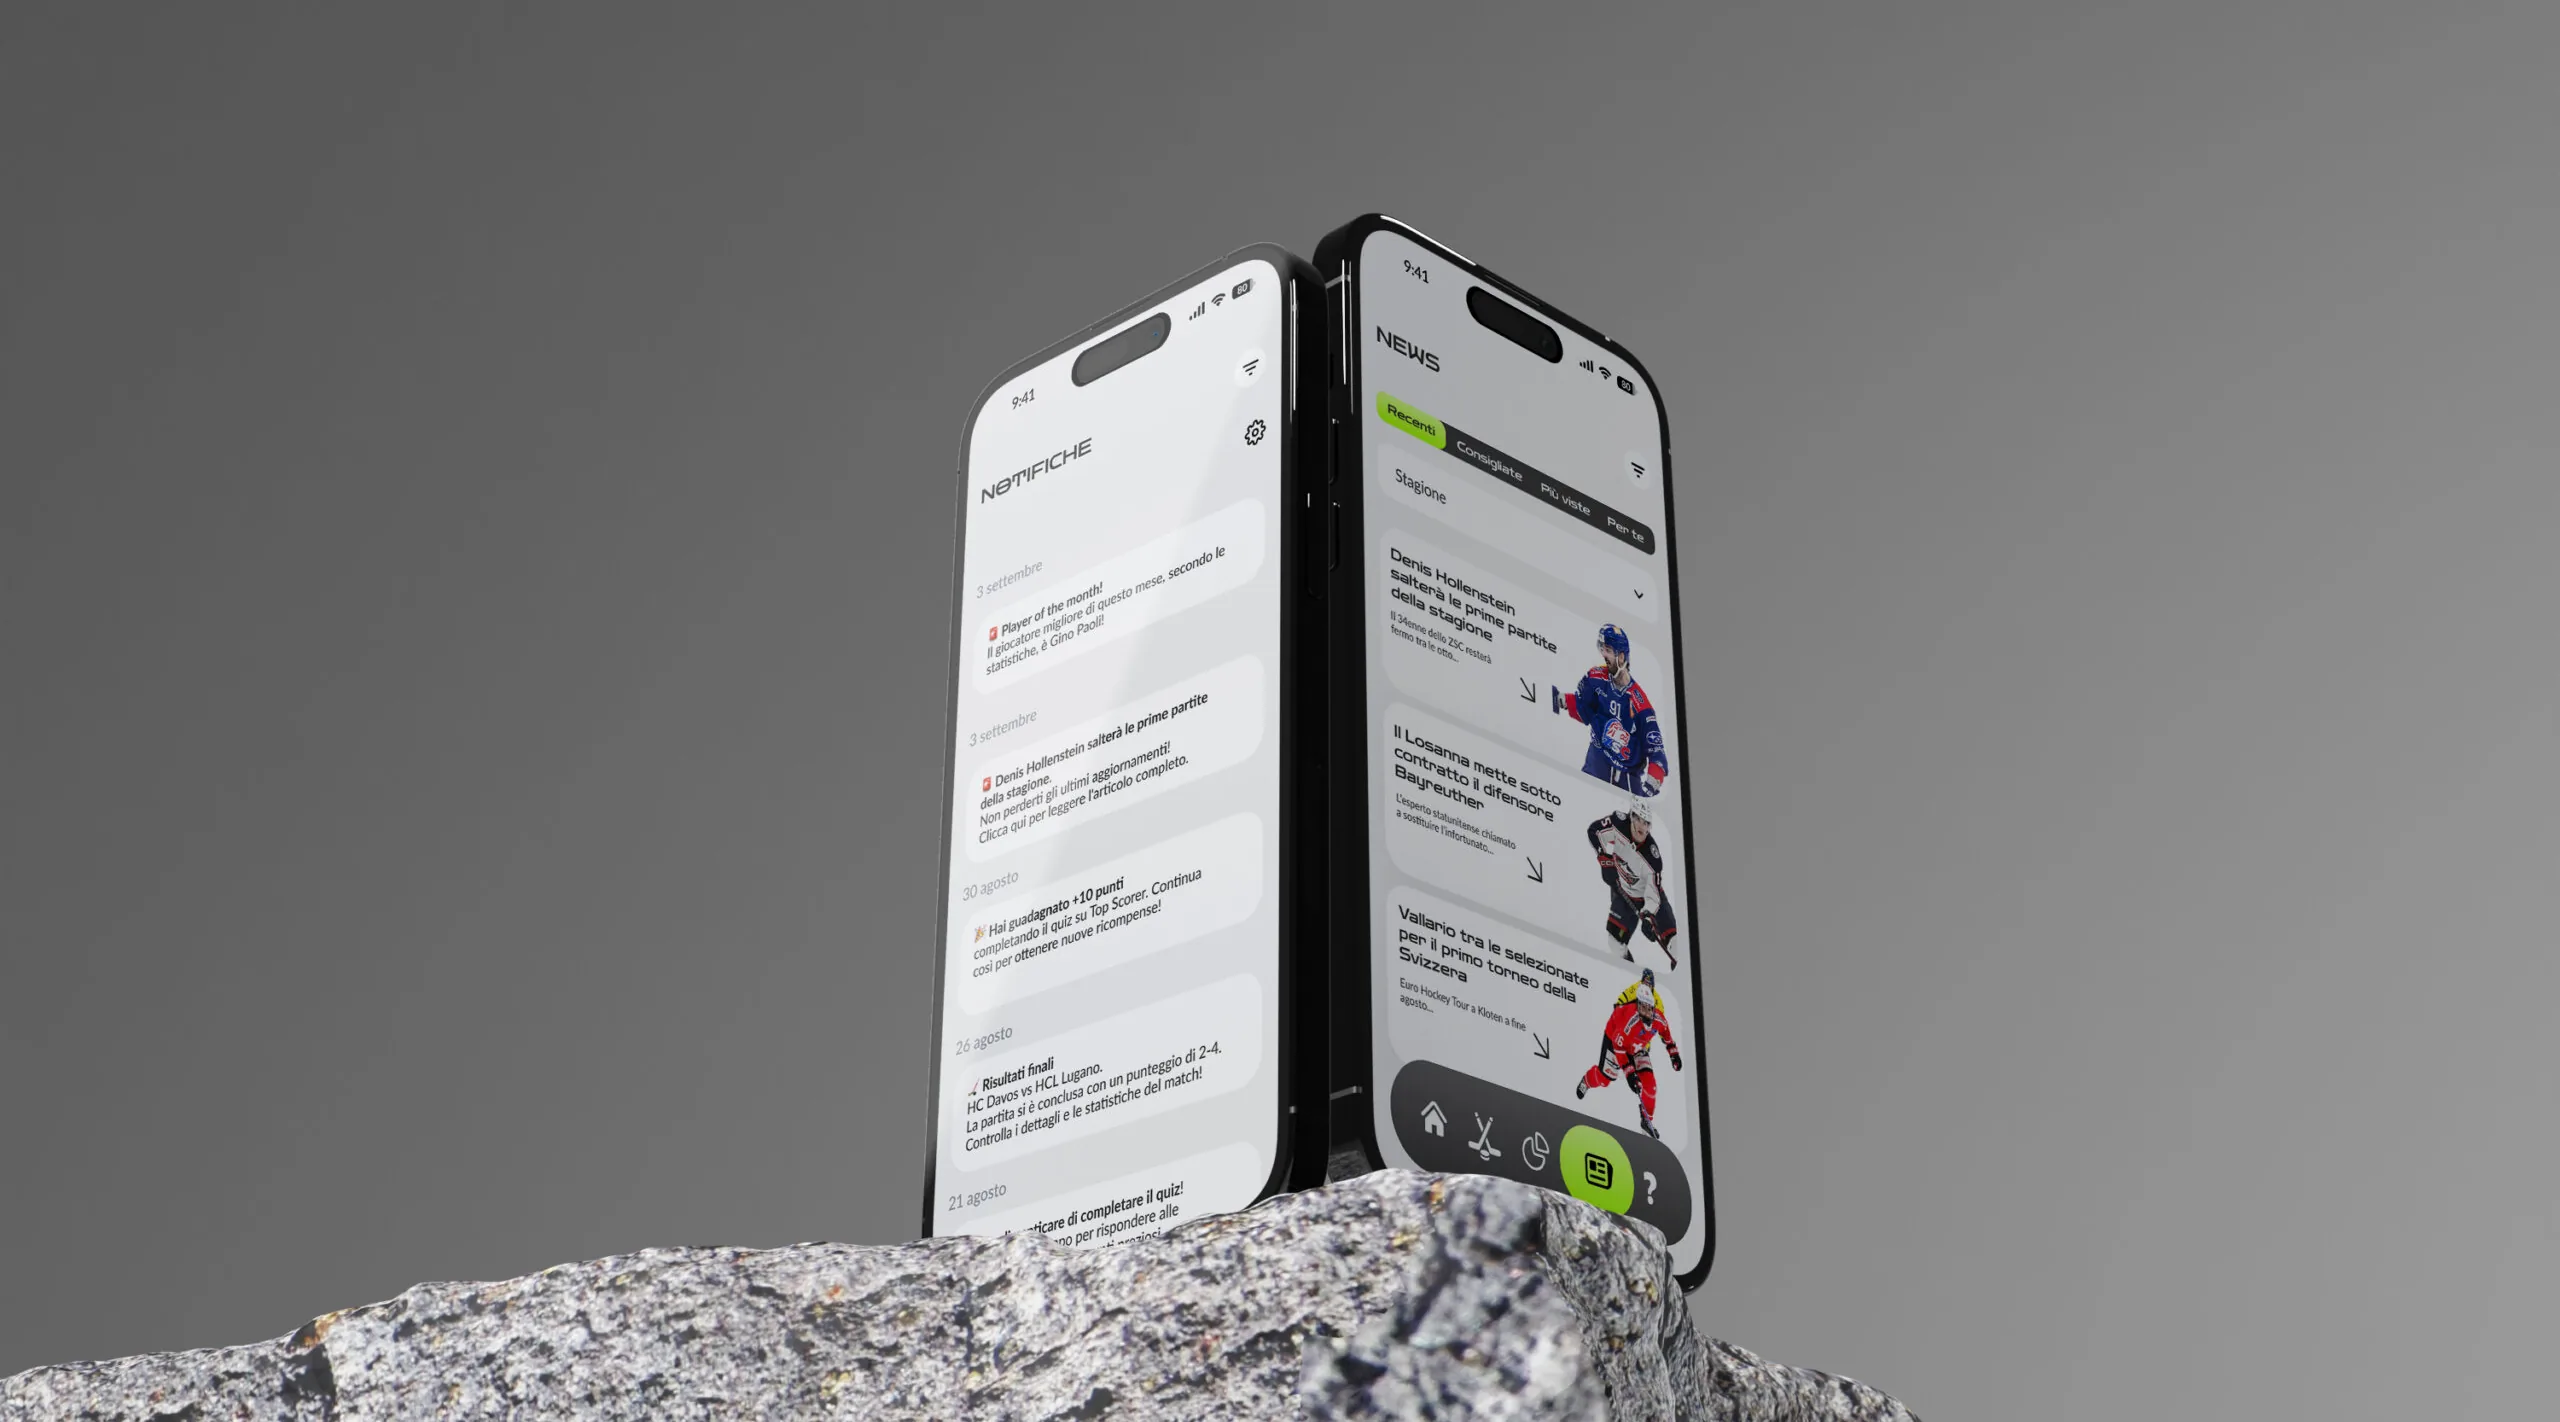
Glide includes a section dedicated to news and results, so users can keep up with what is happening in the world of hockey directly from the app.
Statistics and editorial content live side by side in the same platform, creating a more complete experience for the fan.
-
Quizzes and gamification
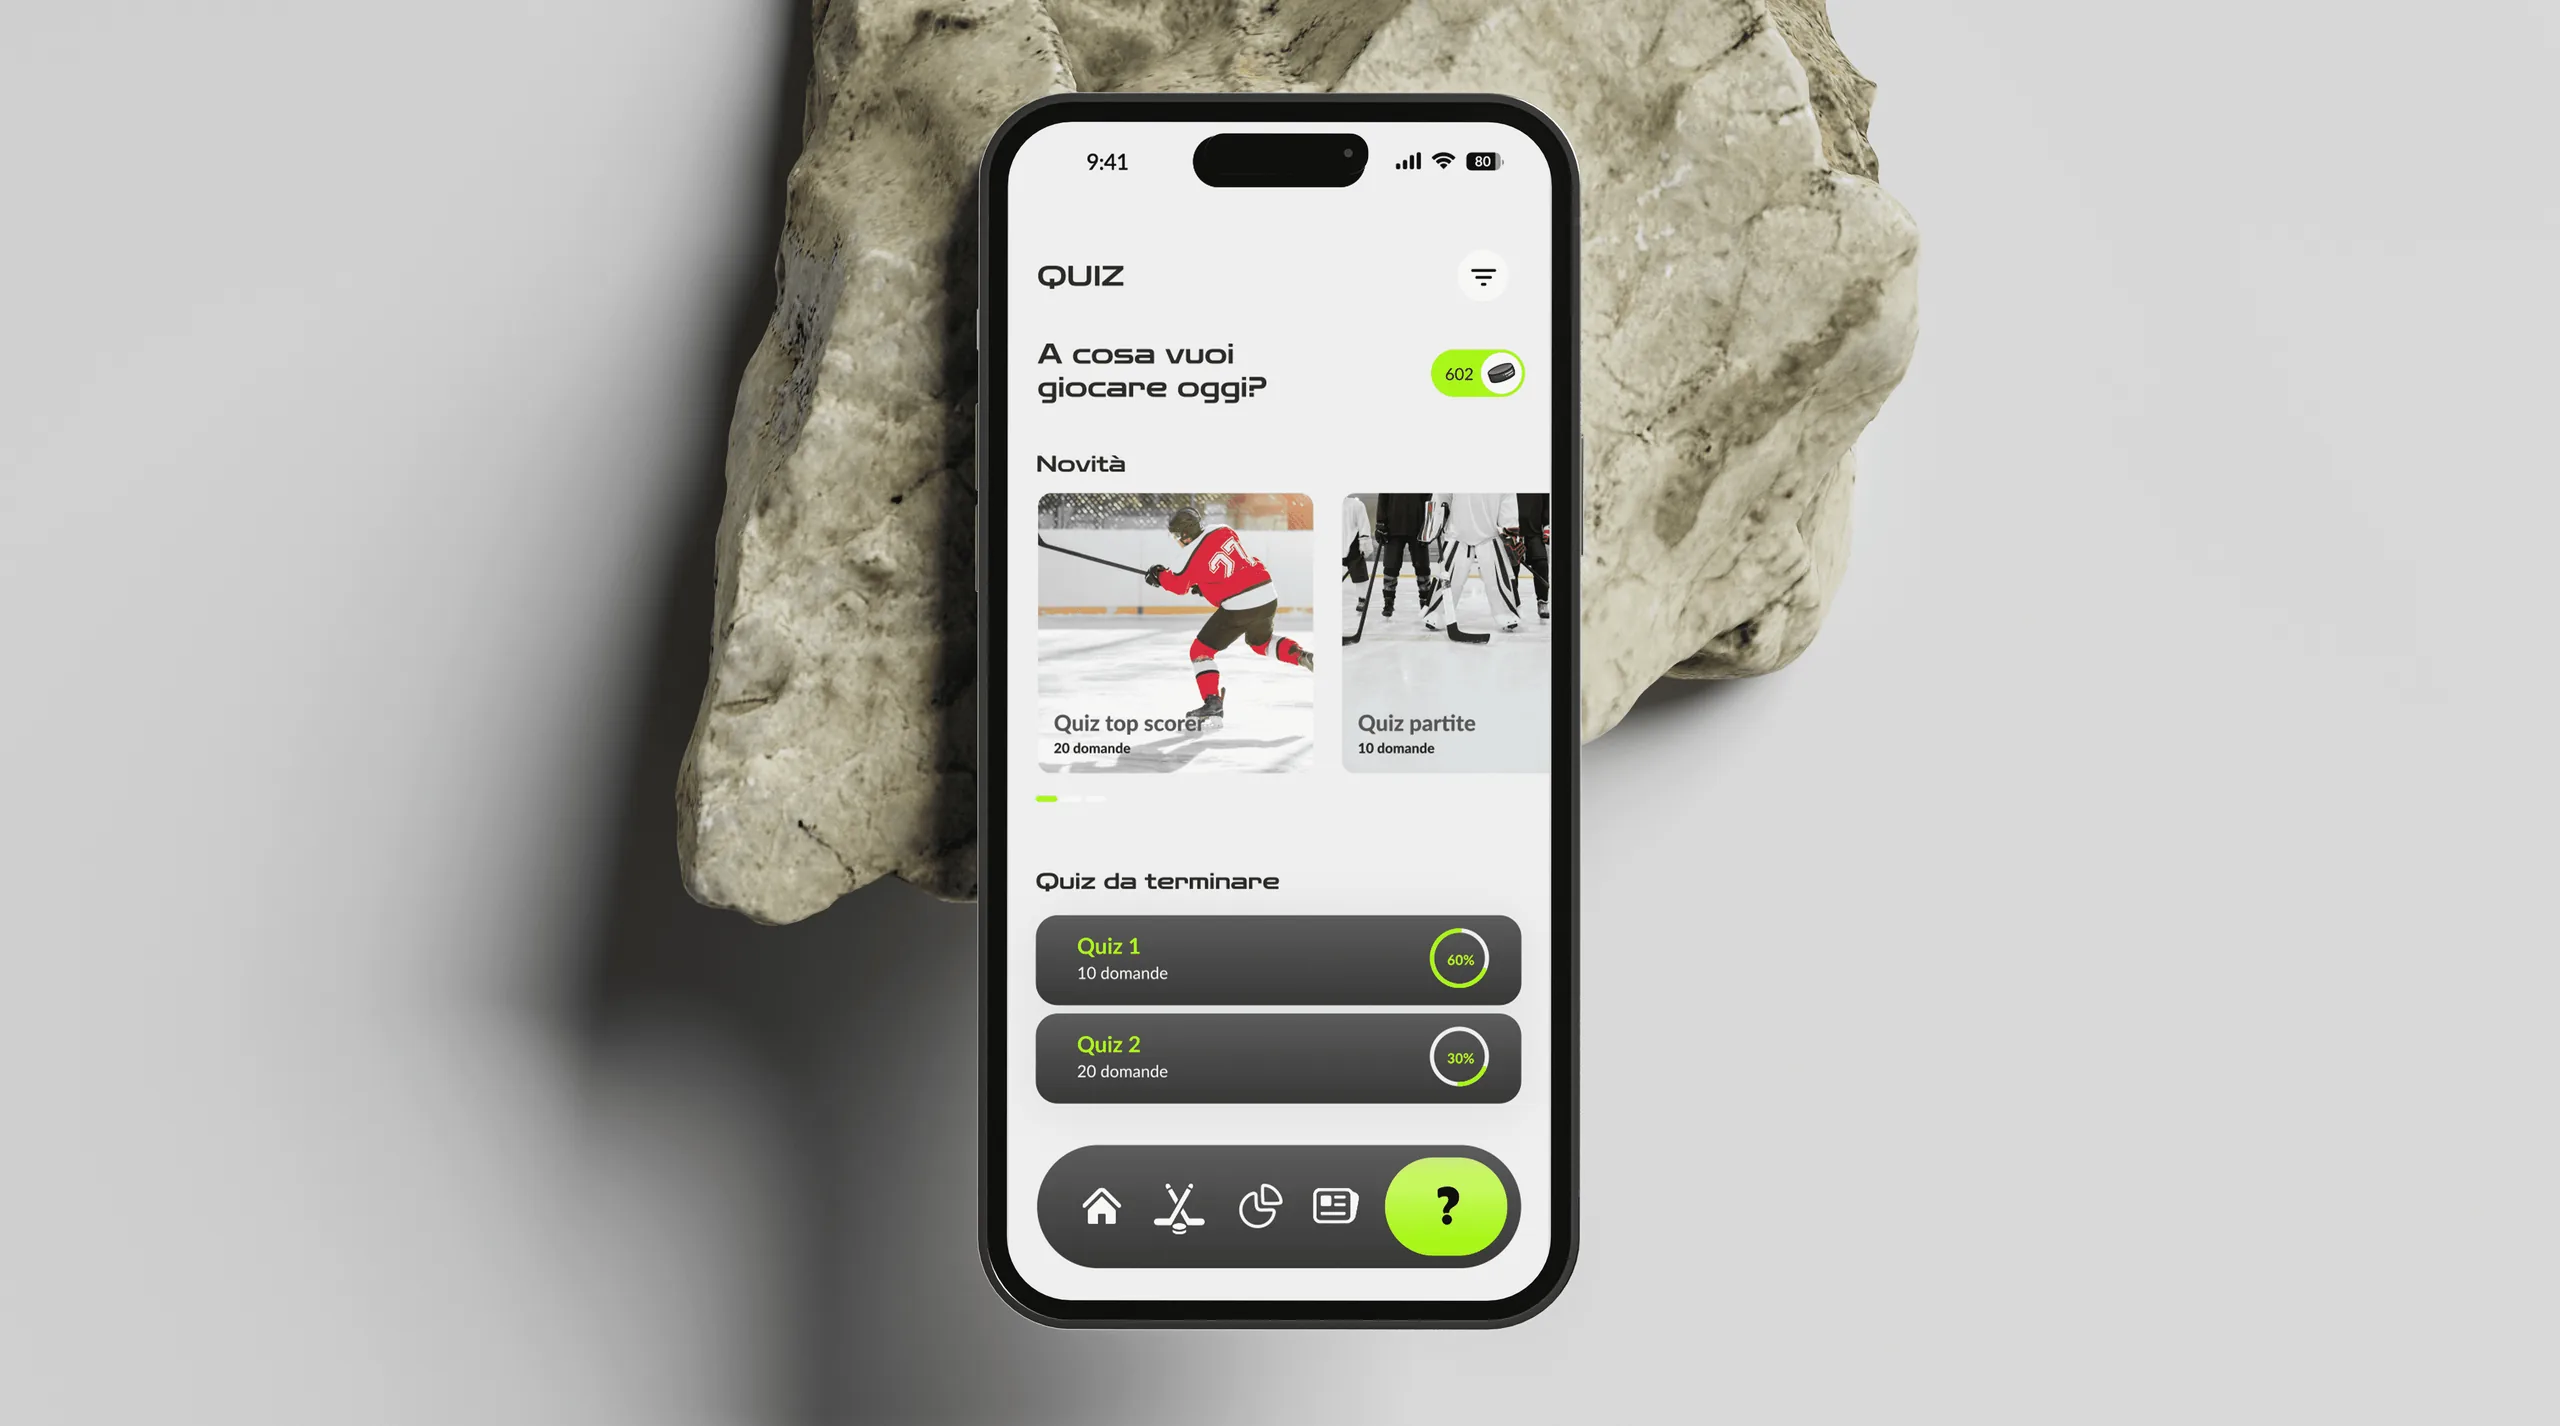
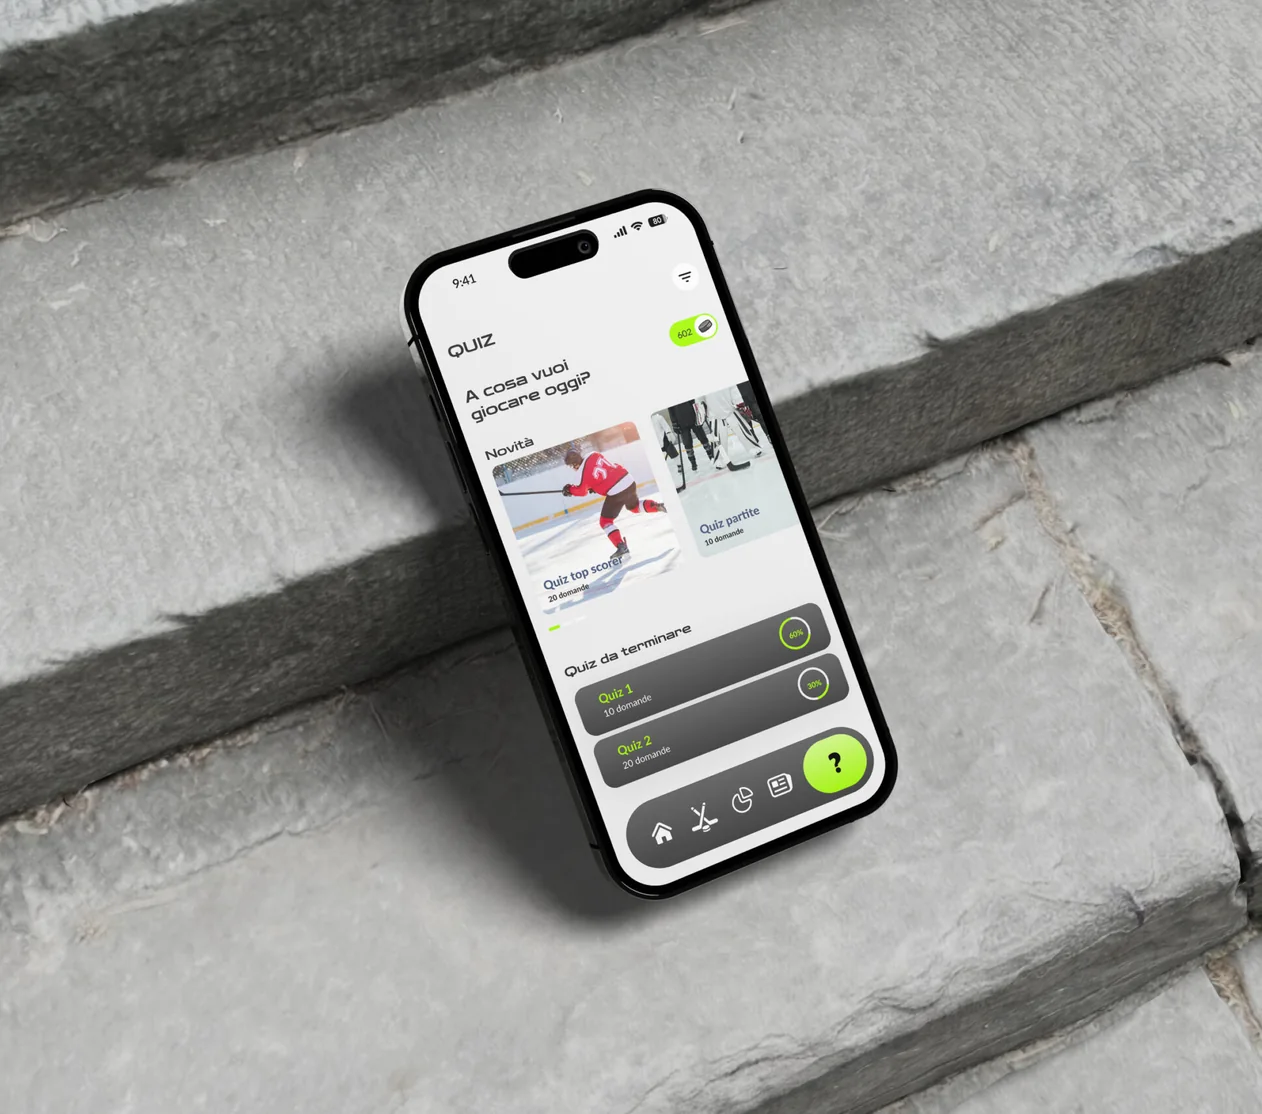
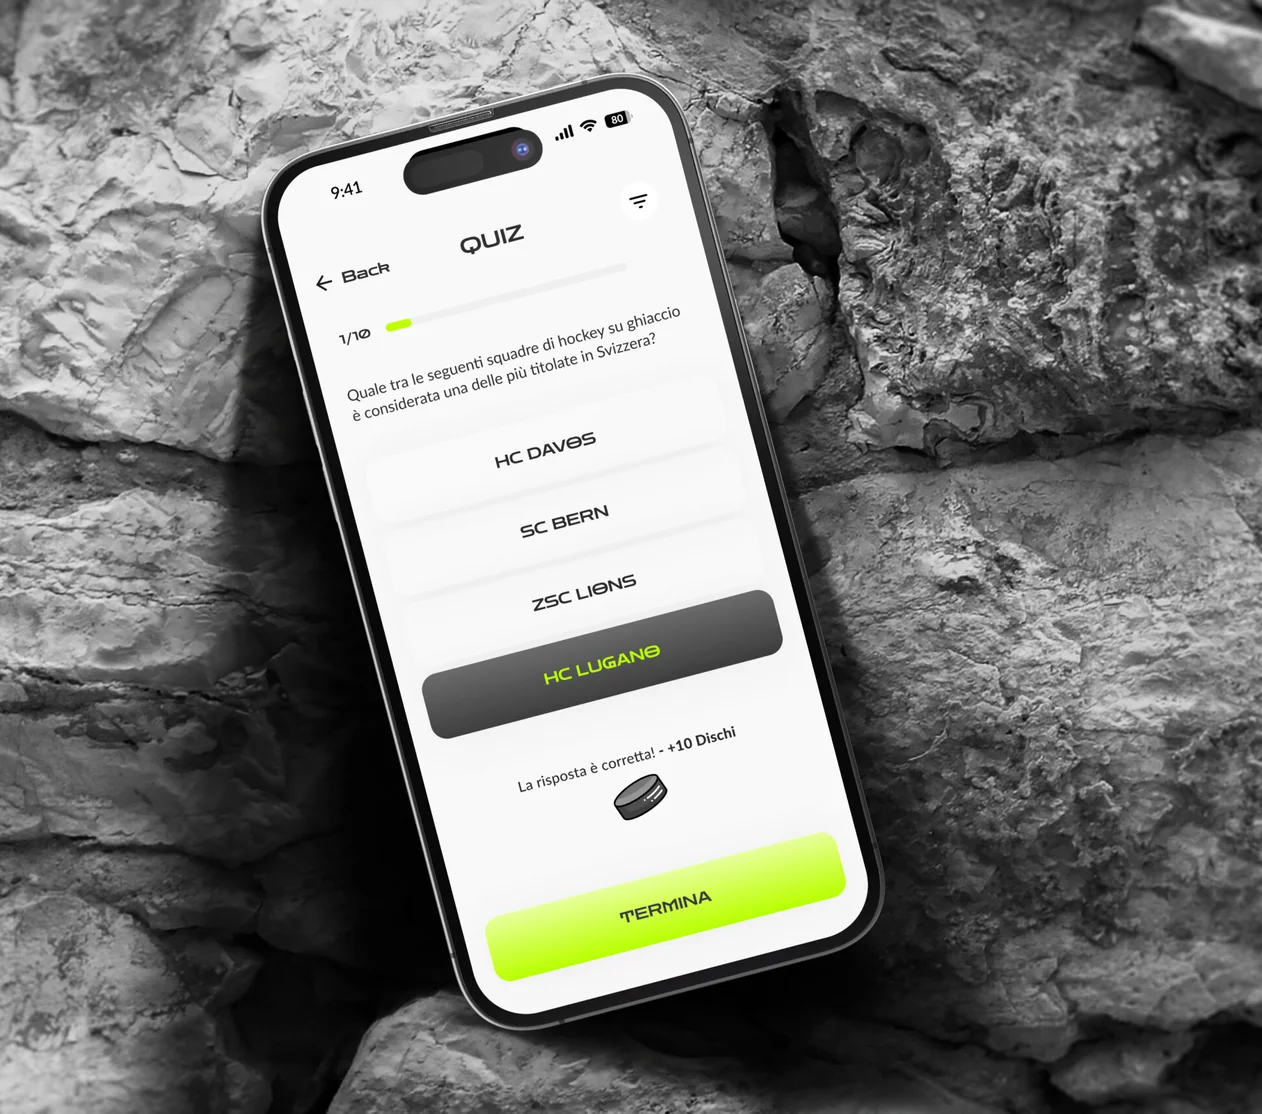
To make the experience even more engaging we introduced a gamification layer based on hockey quizzes. Users can test their knowledge, collect points and unlock premium features and content.
This turns Glide from a simple reference tool into a platform people interact with every day.
The result
Hockey statistics turned into an engaging experience
Glide has turned an experience traditionally based on simply looking up numbers and results into a modern, visual and engaging platform for hockey fans.
The combination of detailed statistics, team and player profiles, results, news and gamification lets users find everything they need to follow and explore their favourite sport in a single place.
The result is an intuitive, content-rich digital product designed to make hockey statistics more accessible and turn browsing data into an enjoyable, engaging experience.